The Chrome performance recording can help us debugging the problem.
See https://developer.chrome.com/docs/devtools/evaluate-performance/reference/
Steps:
- Open Chrome and start from an empty page
- Show the Developer Tools, Menu > View > Developer
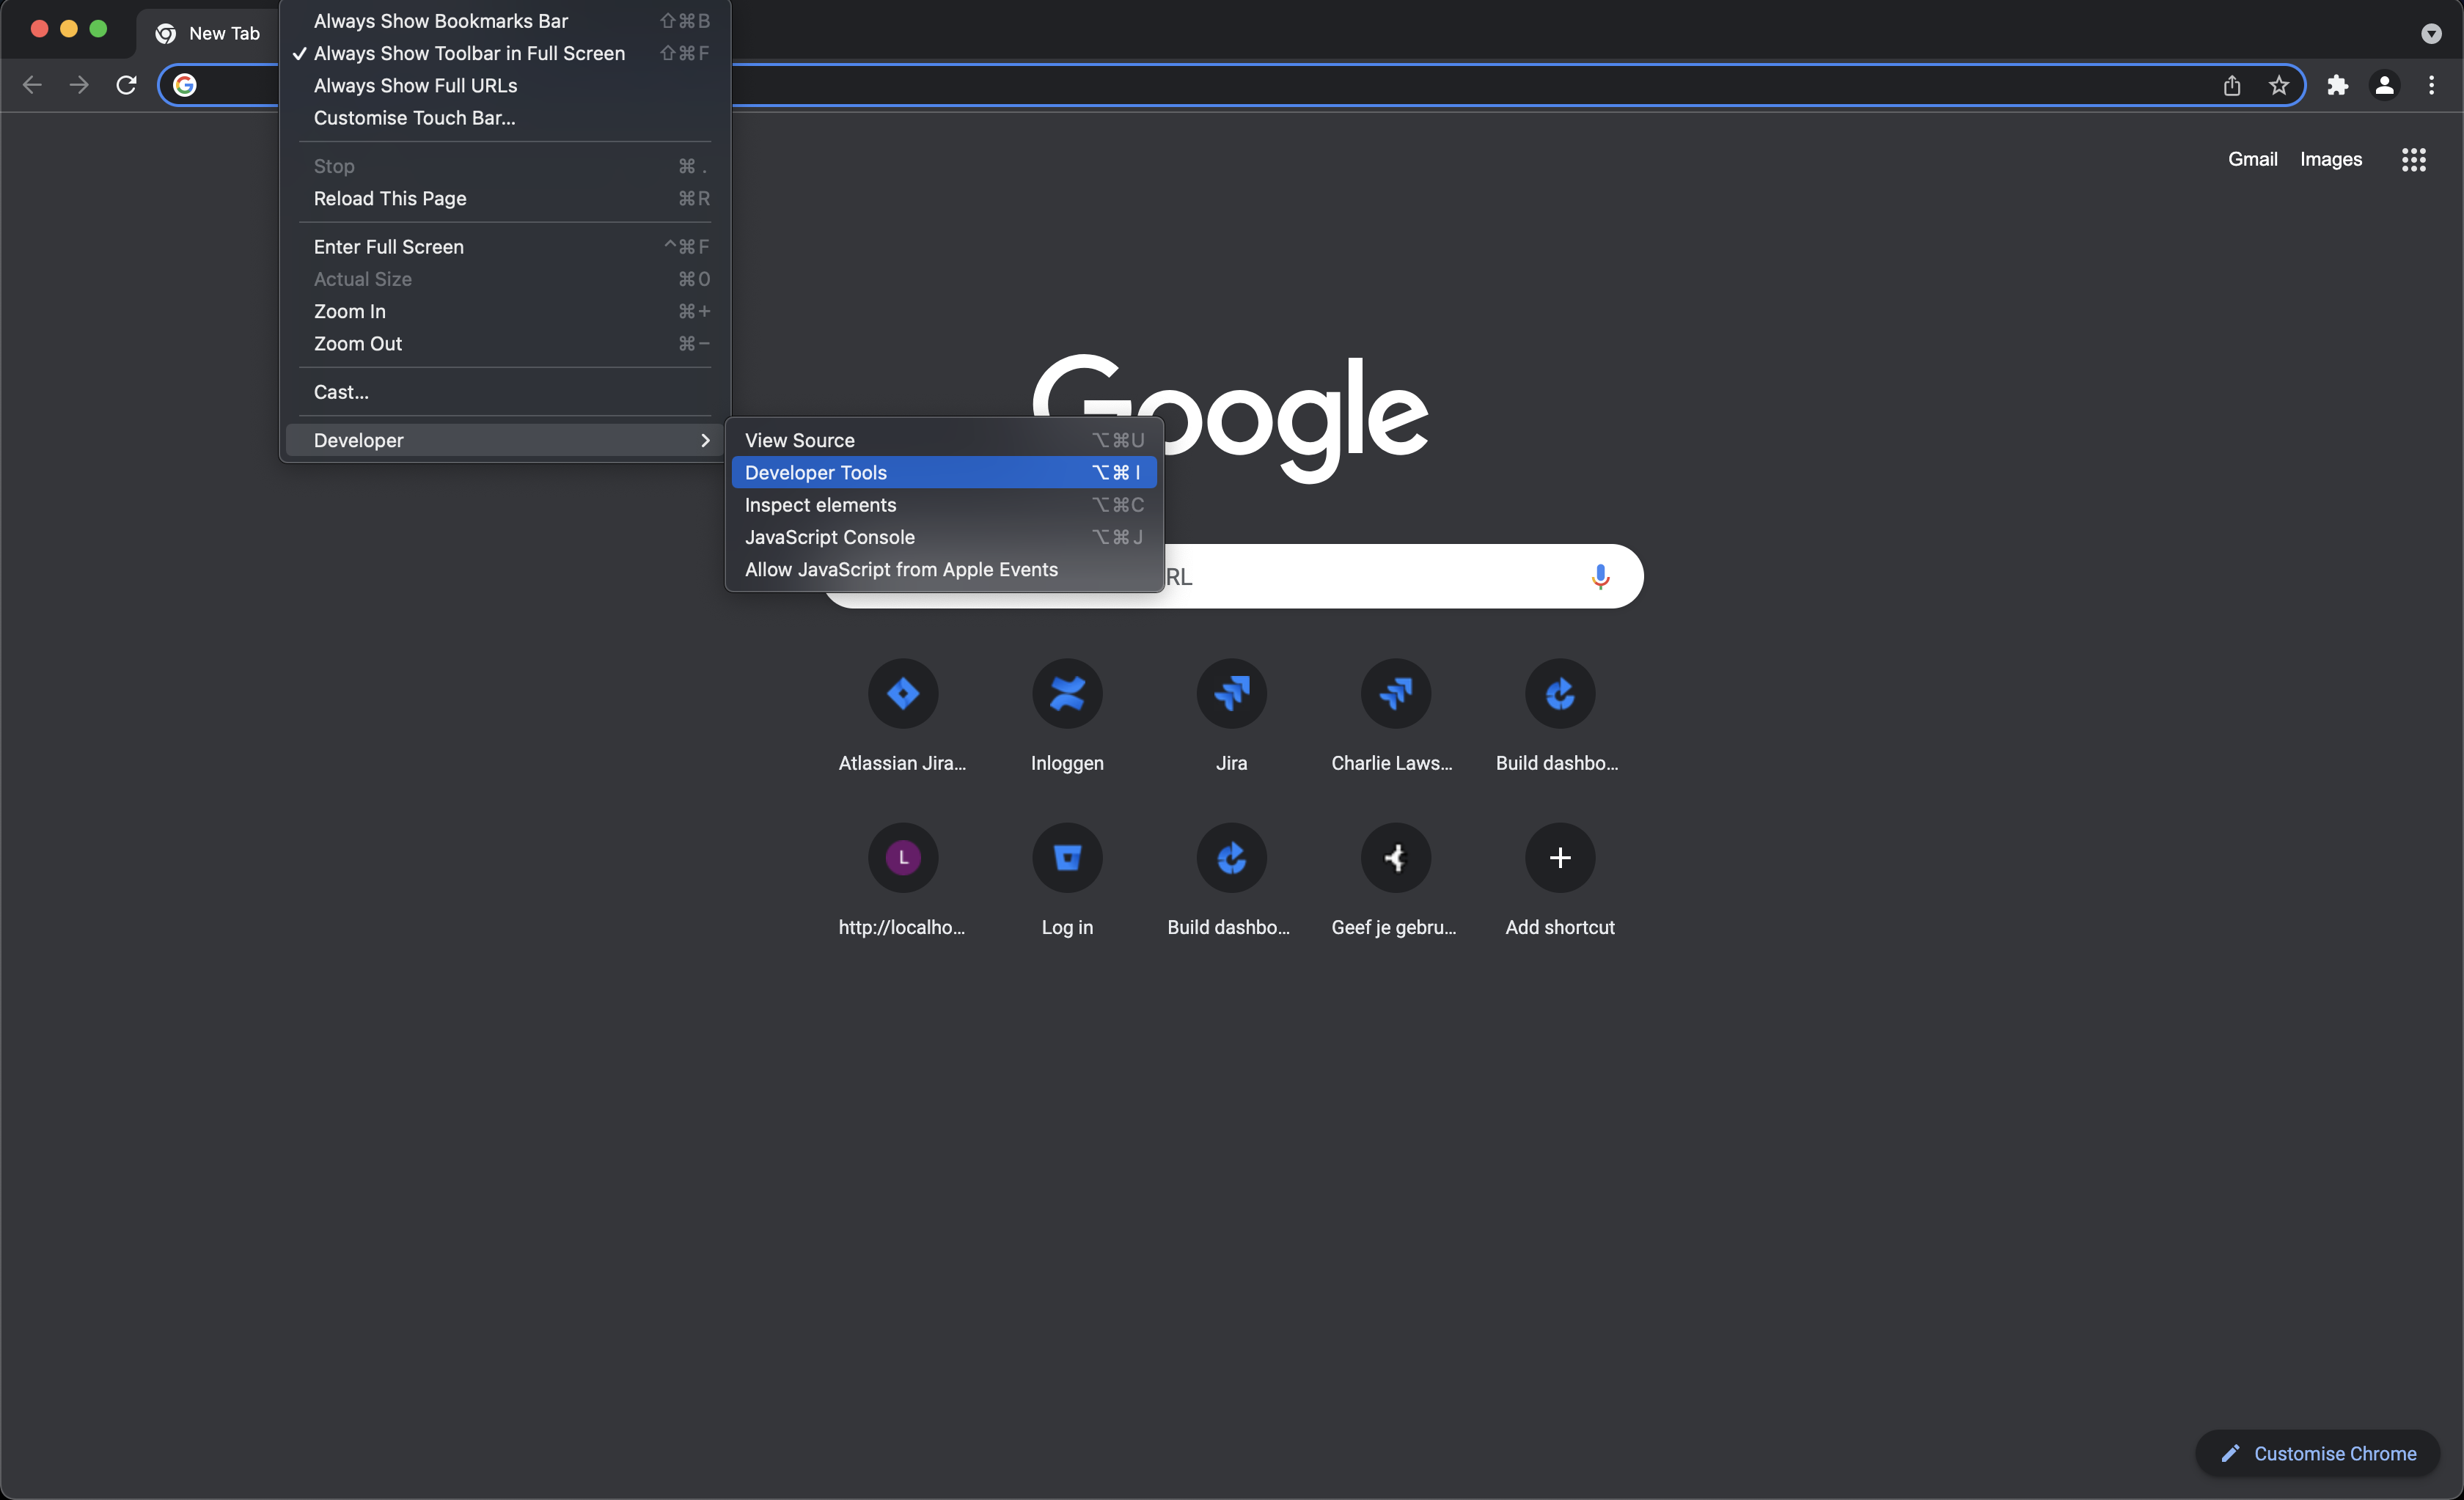
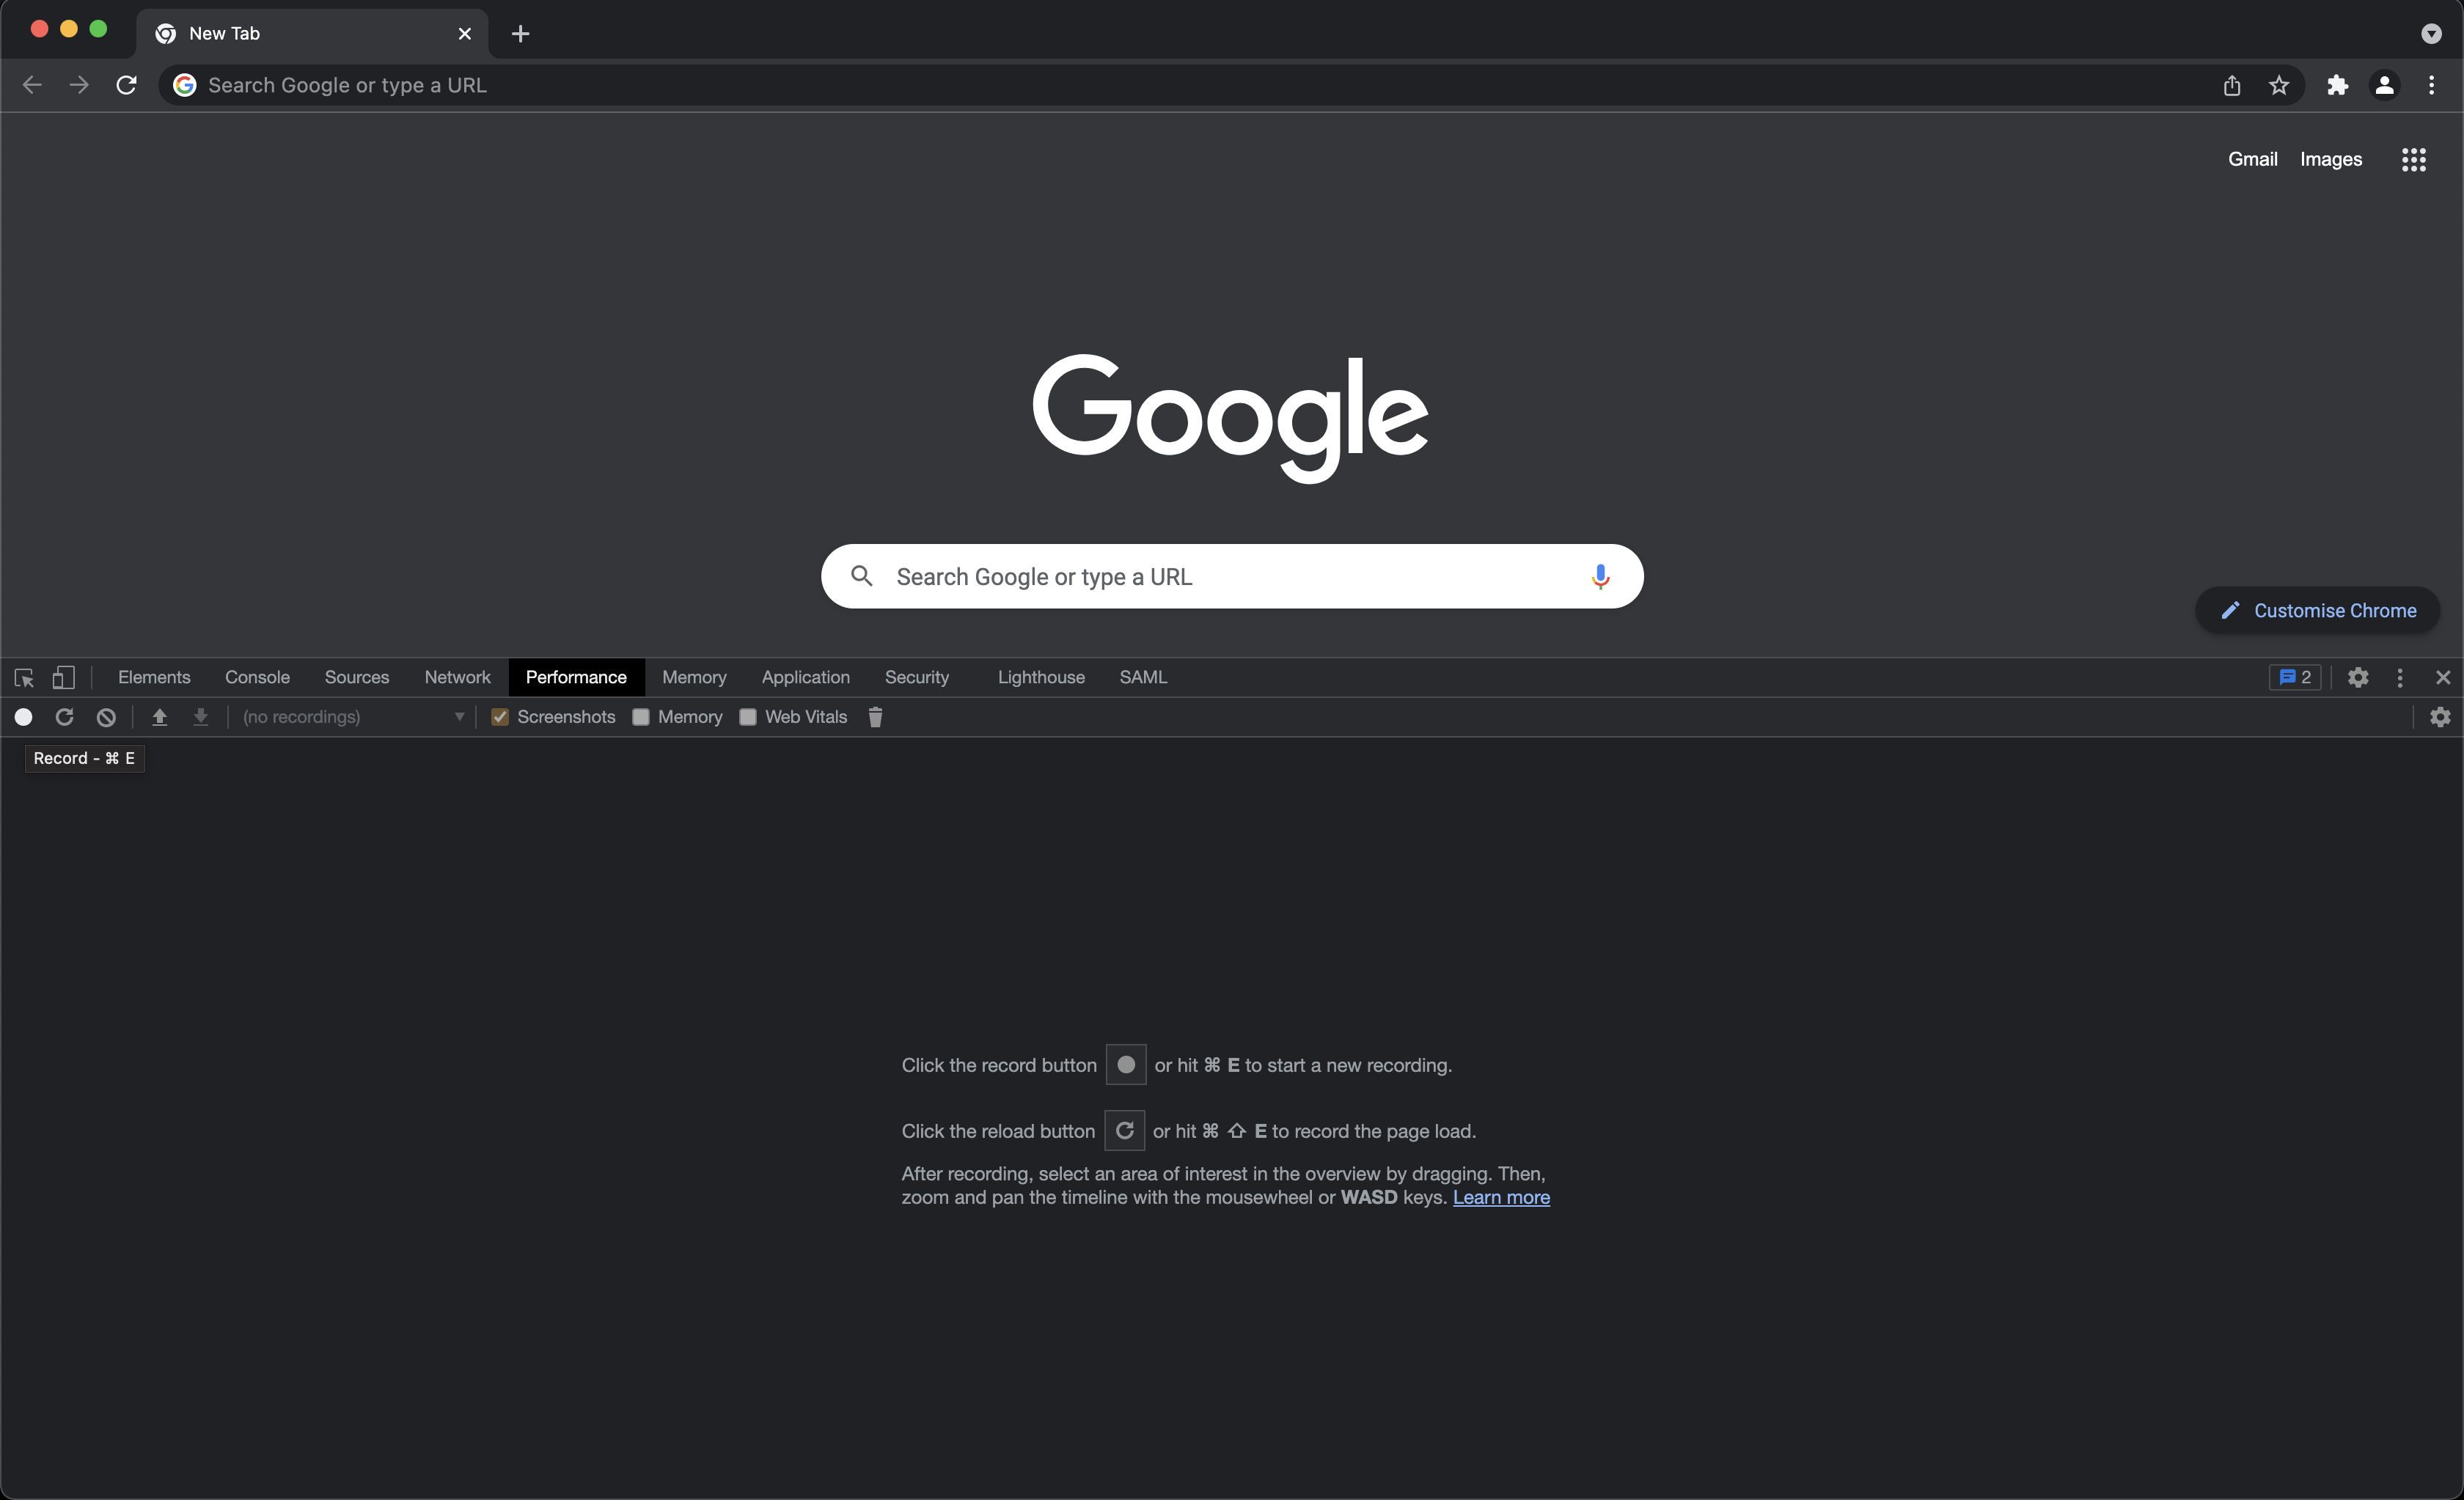
- Open the Performance tab and click the record symbol (left)
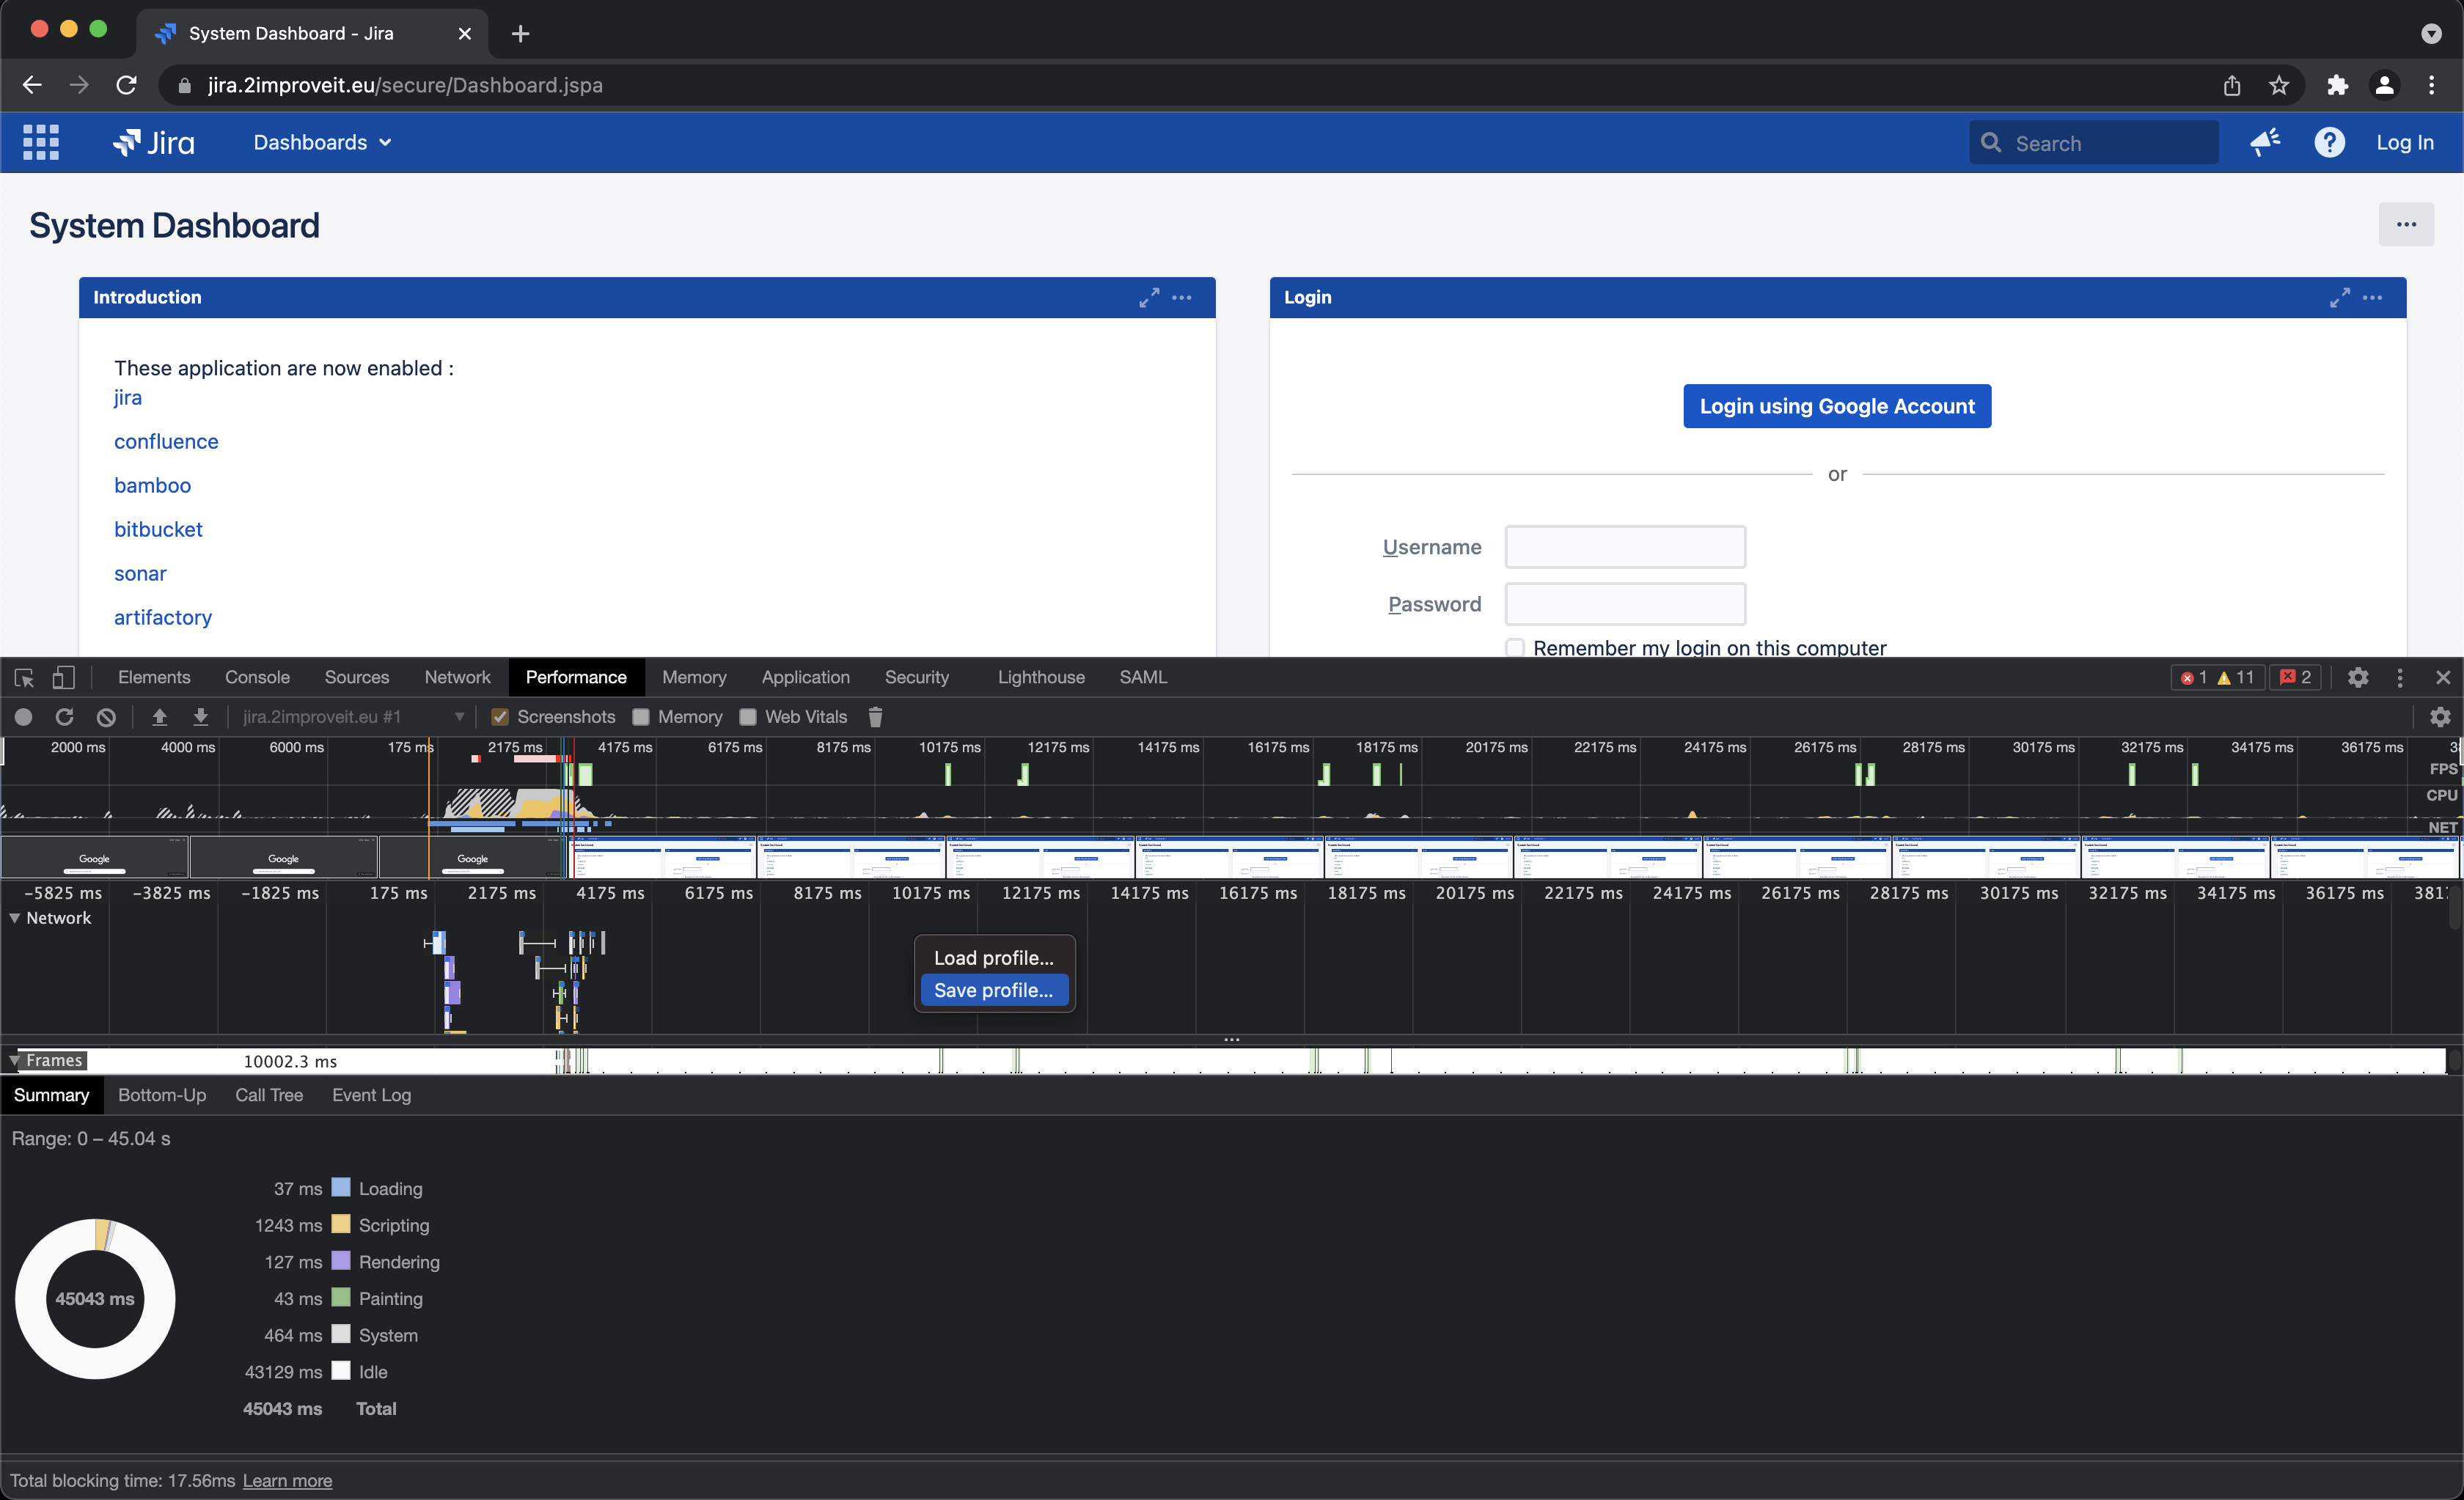
- Go to your Jira / Confluence / Bitbucket page and perform the actions to reproduce the problem
- When you are done, stop the recording and save it (right-click)
- Upload the recording file to the ticket